Drawing a Tree on Canvas with XY Coordinates
A detailed design, development, and recursion analysis to draw a tree data structure with HTML Canvas and TypeScript are given from the solution tree feature implemented into the 2DP Repsymo Solver for the machine replacement model from the operations research field.
The result is a web app that renders an MRM solution tree within 2D coordinates.
Original MRM Problem
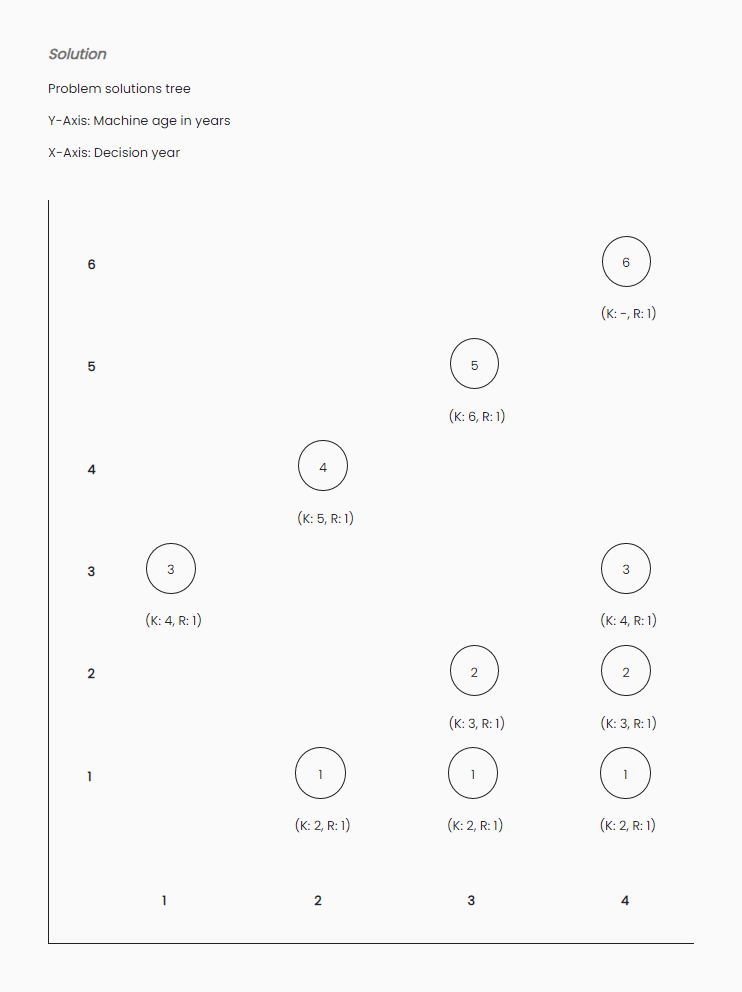
The Machine Replacement Model (MRM) is a deterministic dynamic programming model from operations research. It states that we have a machine with an initial age. We have a number of decision years to know what to do with that machine. Then, for each decision year, there are two options: keep the machine and pay maintenance (K), or replace the machine with a new one (R). All the possible outcomes starting from the first decision year can be visually represented as a tree that grows on the horizontal axis or the same, the independent variable (decision year).
The first solution tree version depicted below was made with HTML, CSS, and
the DOM API (div elements). That version can be found at
EP: MRM1.
It’s recommended to check it out to understand the problem better and get
textbook references. It’s also advisable to review the
Repsymo Solver for a complete insight into this model
(and more).
Chances are obviously limited and the connecting lines from a node to
its next nodes are missing (hence the pairs
The problem consists of populating the binary tree data structure onto a canvas and also the XY-axes to establish each node’s position.
A browser canvas2 (or canvas in general) is not the best performant solution3 but is a great step for this problem in terms of rendering and correctness.
Other Kinds of Trees
Another more common tree data structure is a file explorer which loads your directories and files from your disk. For working with trees we natively implement recursion as the natural or mathematical definition of the problem. Here is another project showing some recursion and designed to work with file systems CP: Distributed Text File System where its left panel with a populated-root-directory is also a tree.
Tree Data Structure
As said above, the nature of many problems is recursive.
There are many ways of representing trees, and one of them is the underlying topic of this article: the solution tree of the MRM. Others are file systems, and so on.
When a wrong data structure is applied (due to engineering constraints) like two-dimensional arrays (cartesian coordinates) to model what actually is a tree (recursive) in this case, algorithms arise, and they’re limited, convoluted, and prone to errors.
Applying the right data structure to a model has more engineering efforts, but it homogenizes the problem down to a simple model that is elegant and correct, in other words, the model matches4 the representation.
EP: MRM Solution Tree
Two elements are required to draw on the canvas: the 2D axis and the tree that grows horizontally. These two elements are what the solution tree application to render consists of.
Getting Started
Create into your HTML a div containing the canvas in which we are going to
draw.
<div id="solutionTreeParent">
  <canvas id="solutionTree"></canvas>
</div>
Some styles can be added.
#solutionTreeParent {
    width: 600px;
    height: 800px;
    margin: 3% auto;
}
Now everything will be programmatically developed.
Create the module mrm-canvas that is going to be developed. It’s going to
contain the following specification that is going to be detailed along with this
article:

This function is going to help with some calculations:
function getHypotenuse(triangleX: number, triangleY: number) {
  return Math.sqrt(Math.pow(triangleX, 2) + Math.pow(triangleY, 2));
}
Resources
- root-node.json: sample tree object to render.
- mrm.ts: assumed data model.
- mrm-canvas.ts: underlying module.
- gh-pr: pull request containing the initial step-by-step development.
Other Resources
- triangle.py: generates the rectangle triangles figure.
Tree Model
The solution tree for the machine replacement model consists of the following data type:
interface TreeNode {
  machineAge: number;
  decisionYear: number;
  k?: TreeNode;
  r?: TreeNode;
}
It follows that the independent variable decisionYear
attribute and the dependent variable machineAge. The tree is binary
so can have two children: k and r.
Thus, we have a binary tree to draw on an XY-plane.
This data structure is an external given model, so it should be added, say,
into a mrm.ts module.
Canvas Design
The following base class is going to manage the canvases. It has the
HTMLCanvasElement (with its respective context) member so the drawing is
performed on that canvas element. The init method sets the canvas element and
its size according to its parent element. The render method runs a standard game
loop operation when the model is updated and then the drawing is performed with
the new model values computed. That means the tree can be re-rendered in
different states if the render method is called.
abstract class MrmCanvas {
  public padding: number;
  private canvasEl: HTMLCanvasElement;
  private ctx: CanvasRenderingContext2D;

  protected constructor() {
    this.padding = 0;
  }

  get width() {
    return this.canvasEl.width;
  }

  get height() {
    return this.canvasEl.height;
  }

  init(canvasEl: HTMLCanvasElement) {
    this.canvasEl = canvasEl;
    this.ctx = this.canvasEl.getContext('2d');
    this.updateCanvasSize();
    this.update();
  }

  render() {
    this.update();
    this.draw(this.ctx);
  }

  private updateCanvasSize() {
    const parentEl = document.getElementById(parentElId);
    this.canvasEl.width = parentEl.offsetWidth - this.padding;
    this.canvasEl.height = parentEl.offsetHeight - this.padding;
  }

  protected abstract update();

  protected abstract draw(ctx: CanvasRenderingContext2D);
}
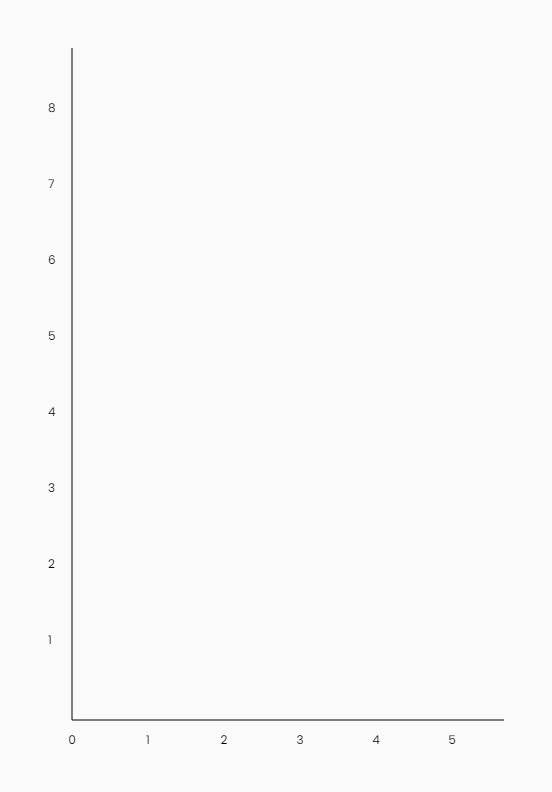
Drawing the Axes
First, the axes lines are easily drawn:
ctx.font = '12px Poppins';
ctx.fillStyle = 'black';

ctx.moveTo(this.padding, 0);
ctx.lineTo(this.padding, this.height - this.padding);
ctx.lineTo(this.width, this.height - this.padding);
ctx.lineWidth = 1;
ctx.stroke();
To draw the cellSizePx
that tells the width and height of each cell in the XY-plane (first quadrant).
ctx.textAlign = 'center';

for (let i = 0; i <= this.maxAbscissa; i++) {
  const x = (i * this.cellSizePx) + this.padding;
  ctx.fillText(String(i), x, this.height);
}
For drawing the
ctx.textAlign = 'start';

for (let i = 1; i <= this.maxOrdinate; i++) {
  const y = this.height - (i * this.cellSizePx) - this.padding;
  ctx.fillText(String(i), 0, y);
}
These results are compiled into the TreeAxesCanvas class:
class TreeAxesCanvas extends MrmCanvas {
  public static readonly AXIS_LABEL_SIZE_PX = 24;
  public maxAbscissa: number;
  public maxOrdinate: number;
  private cellSizePx: number;

  constructor() {
    super();
    this.padding = TreeAxesCanvas.AXIS_LABEL_SIZE_PX;
    this.maxAbscissa = 5;
    this.maxOrdinate = 8;
  }

  get cellSize() {
    return this.cellSizePx;
  }

  protected update() {
    this.cellSizePx = this.width / (this.maxAbscissa + 1);
  }

  protected draw(ctx) {
    ctx.font = '12px Poppins';
    ctx.fillStyle = 'black';
    ctx.strokeStyle = 'black';

    ctx.moveTo(this.padding, 0);
    ctx.lineTo(this.padding, this.height - this.padding);
    ctx.lineTo(this.width, this.height - this.padding);
    ctx.lineWidth = 1;
    ctx.stroke();
    this.drawXLabels(ctx);
    this.drawYLabels(ctx);
  }

  private drawXLabels(ctx) {
    ctx.textAlign = 'center';

    for (let i = 0; i <= this.maxAbscissa; i++) {
      const x = (i * this.cellSizePx) + this.padding;
      ctx.fillText(String(i), x, this.height);
    }
  }

  private drawYLabels(ctx) {
    ctx.textAlign = 'start';

    for (let i = 1; i <= this.maxOrdinate; i++) {
      const y = this.height - (i * this.cellSizePx) - this.padding;
      ctx.fillText(String(i), 0, y);
    }
  }
}
Then
const canvasEl = document.getElementById('solutionTree') as HTMLCanvasElement;
const axesCanvas = new TreeAxesCanvas();

axesCanvas.init(canvasEl);
axesCanvas.render();
Drawing the Tree
The tree canvas is quite more complicated. The class consists of the following structure:
class SolutionTreeCanvas extends MrmCanvas {
  private readonly axesCanvas: TreeAxesCanvas;
  public rootNode: TreeNode;
  private radiusPx: number;

  constructor() {
    super();
    this.axesCanvas = new TreeAxesCanvas();
    this.rootNode = newTreeNode();
  }

  init(canvasEl) {
    super.init(canvasEl);
    this.axesCanvas.init(canvasEl);
  }

  render() {
    super.render();
    this.axesCanvas.render();
  }

  protected update() {
    this.radiusPx = this.axesCanvas.cellSize / 4;
  }

  protected draw(ctx) {
    const memoization = new Set<string>();

    this.drawNode(ctx, this.rootNode, memoization);
  }

  private drawNode(ctx: CanvasRenderingContext2D, node: TreeNode, memoization: Set<string>) {/* ... */}

  private drawNodeLines(ctx: CanvasRenderingContext2D, node: TreeNode, memoization: Set<string>) {/* ... */}

  private drawNodeCircle(ctx: CanvasRenderingContext2D, node: TreeNode) {/* ... */}

  private drawNodeContent(ctx: CanvasRenderingContext2D, node: TreeNode) {/* ... */}

  private getNodeCP(node: TreeNode) {/* ... */}
}
Notice we have:
- An axes canvas: To draw the axes.
- The root node: The tree data structure that is going to be drawn.
- A radius: A computed value for a node’s radius.
- Memoization: To avoid drawing nodes that have already been drawn due to the recursive algorithm.
Finally, yes, the drawNode method is going to be the recursive function. You
can start noticing it is called to draw the root node, so it ends up drawing all
the children recursively.
Regarding the helper method getNodeCP we have the following code to get the
center point of the given node:
const cp = {
  x: (node.decisionYear * this.axesCanvas.cellSize) + TreeAxesCanvas.AXIS_LABEL_SIZE_PX,
  y: this.height - (node.machineAge * this.axesCanvas.cellSize) - TreeAxesCanvas.AXIS_LABEL_SIZE_PX
}
Drawing a Node
This is the recursive function to populate the whole tree from the root node. We take care of memoization to dynamically store the drawn nodes. For correctness effects, we always render the node circle and its content but the node lines and labels (which are visually significant if rendered more than once) are only rendered once.
const point2d = { x: node.decisionYear, y: node.machineAge };
const point2dStr = JSON.stringify(point2d);
const hasNeverBeenDrawn = !memoization.has(point2dStr);

if (hasNeverBeenDrawn) {
  this.drawNodeLines(ctx, node, memoization);
}
this.drawNodeCircle(ctx, node);
this.drawNodeContent(ctx, node);
memoization.add(point2dStr);
So, it takes three steps:
- Draw the outgoing lines with their corresponding labels.
- Draw the circle with a background and border.
- Draw the node content consisting of its
machineAge(y-coordinate) attribute.
The method drawNodeLines calls back to this method so initiates the recursion
process. That one is left to the end as it’s the harder.
Node Circle and Content
These are pretty straightforward.
To draw the circle:
const { x, y } = this.getNodeCP(node);
ctx.beginPath();
ctx.arc(x, y, this.radiusPx, 0, 2 * Math.PI);
ctx.fillStyle = 'white';
ctx.fill();
ctx.stroke();
To draw the content inside the node:
ctx.font = '24px Poppins';
ctx.textAlign = 'center';
ctx.fillStyle = 'black';
const txt = String(node.machineAge);
const txtMetrics = ctx.measureText(txt);
const txtHeight = txtMetrics.actualBoundingBoxAscent + txtMetrics.actualBoundingBoxDescent;
const { x, y } = this.getNodeCP(node);
ctx.fillText(txt, x, y + txtHeight / 2);
Notice in the call to measureText, we use an advanced Canvas API to get the
text height and be able to center it vertically. It is horizontally centered
with ctx.textAlign = 'center'.
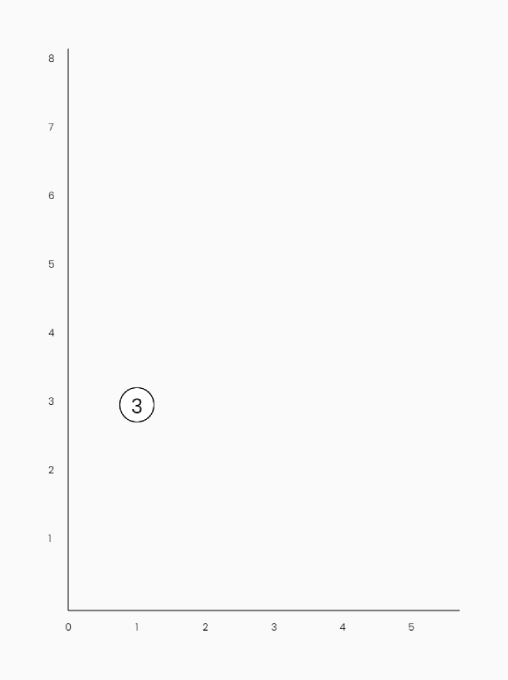
By running at this stage we obtain the first node drawn representing the initial decision year:
const canvasEl = document.getElementById('solutionTree') as HTMLCanvasElement;
const canvas = new SolutionTreeCanvas();
canvas.rootNode = this.solver.getSolutionTree(); // Use your tree here

canvas.init(canvasEl);
canvas.render();
Line with Labels from Node-to-Node
First, we need some definitions to address this challenge:
const padding = TreeAxesCanvas.AXIS_LABEL_SIZE_PX;
const { x, y } = this.getNodeCP(node);
const isNodeNext = (next: TreeNode) => node.machineAge === 1 && next.machineAge === 1;
const isNodeBelow = (next: TreeNode) => node.machineAge < next.machineAge;
The
Drawing the line is straightforward:
const nextX = (next.decisionYear * this.axesCanvas.cellSize) + padding;
const nextY = this.height - (next.machineAge * this.axesCanvas.cellSize) - padding;
ctx.beginPath();
ctx.moveTo(x, y);
ctx.lineTo(nextX, nextY);
ctx.stroke();
The rectangle triangle defined by the two-node points is going to be useful for computing the directions for the outgoing lines from the current node to the next one. We simply use similar triangles to obtain the requesting points.

const triangle = (next: TreeNode) => {
  const nextCP = this.getNodeCP(next);
  const nextX = nextCP.x;
  const nextY = nextCP.y;
  const triangleX = nextX - x;
  const triangleY = Math.abs(nextY - y);
  const hypotenuse = getHypotenuse(triangleX, triangleY);
  return { triangleX, triangleY, hypotenuse };
};
With that information we can draw the lines according to the corresponding quadrant: up, straight or right, down. The next node is always to the right as the decision year always increases.
const drawUpRightLabel = (next: TreeNode, label: string) => {
  const { triangleX, triangleY, hypotenuse } = triangle(next);
  const labelX = x + (triangleX * this.radiusPx / hypotenuse);
  const labelY = y - (triangleY * this.radiusPx / hypotenuse) - 8;
  ctx.fillText(label, labelX, labelY);
};

const drawDownRightLabel = (next: TreeNode, label: string) => {
  const { triangleX, triangleY, hypotenuse } = triangle(next);
  const labelX = x + (triangleX * this.radiusPx / hypotenuse) - 4;
  const labelY = y + (triangleY * this.radiusPx / hypotenuse) + 16;
  ctx.fillText(label, labelX, labelY);
};

const drawRightLabel = (next: TreeNode, label: string) => {
  const { triangleX, triangleY, hypotenuse } = triangle(next);
  const labelX = x + (triangleX * this.radiusPx / hypotenuse) + 4;
  const labelY = y + (triangleY * this.radiusPx / hypotenuse) + 16;
  ctx.fillText(label, labelX, labelY);
};
Then just call one of these functions to draw the appropriate line:
const drawLabelTo = (next: TreeNode, label: string) => {
  ctx.font = '12px Poppins';
  ctx.textAlign = 'center';
  ctx.fillStyle = 'black';

  if (isNodeBelow(next)) {
    drawUpRightLabel(next, label);
  }
  else if (isNodeNext(next)) {
    drawRightLabel(next, label);
  }
  else {
    drawDownRightLabel(next, label);
  }
};
Finally, to implement the method drawNodeLines we draw the line to the
“Keep” node and to the “Replace” node by making use of recursion:
if (node.k) {
  drawLineTo(node.k);
  drawLabelTo(node.k, 'K');
  this.drawNode(ctx, node.k, memoization); // Recursive call
}
if (node.r) {
  drawLineTo(node.r);
  drawLabelTo(node.r, 'R');
  this.drawNode(ctx, node.r, memoization); // Recursive call
}
The initial method drawNode is called recursively (recall that drawNode was
the caller and drawNodeLines is the callee) and the memoization
set is carried to the method call.
Enhancing Rendering Sizes
For managing more proper rendering sizes this may be an idea.
Another option is to call the method init on window size changed, adding
scroll, etc. Performance should be considered here.
Result
By importing the developed module, the API is then consumed as follows:
const canvasEl = document.getElementById('solutionTree') as HTMLCanvasElement;
const canvas = new SolutionTreeCanvas();
const tree = this.solver.getSolutionTree(); // Replace with your tree

canvas.rootNode = tree;
canvas.init(canvasEl);

canvas.render();
By running now, we get the desired result:
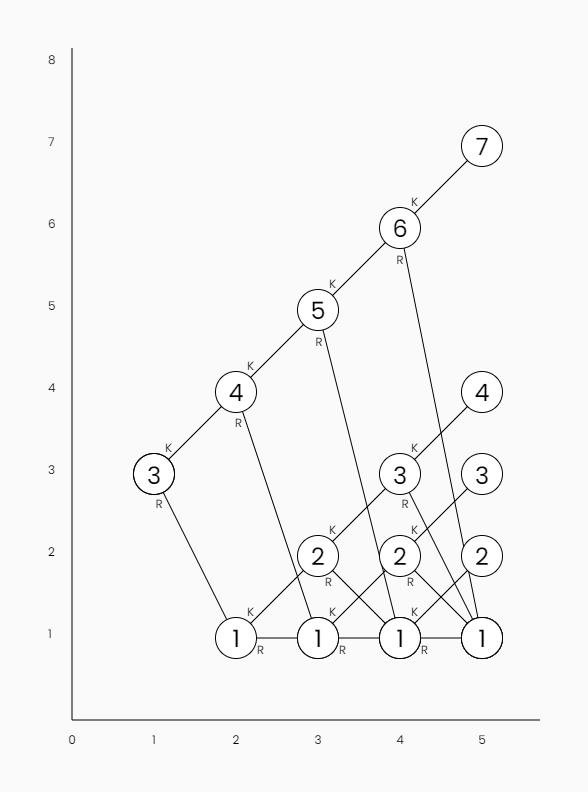
The result is deployed to the example project app.
Analysis
Analysis on correctness and performance is detailed.
Memoization
If we remove the memoization, nodes will be rendered more than once which is not acceptable. The results are shown below. Recall that we still render the node circle and content to fix incorrectness but the lines and labels must not be drawn more than once. Excluding the lines (and labels) drawing is a partial drawing, so we only draw the circle and content.
The tree is binary, contains
| Technique | Rendering Times |
|---|---|
| With Memoization (partial drawings) | 15 |
| With Memoization (whole and partial drawings) | 21 |
| Without Memoization | 31 |
Hence, the drawNode function is called
With memoization off is visually clear that nodes are being rendered on top of
themselves, so it’s easy to spot that flaw (notice node
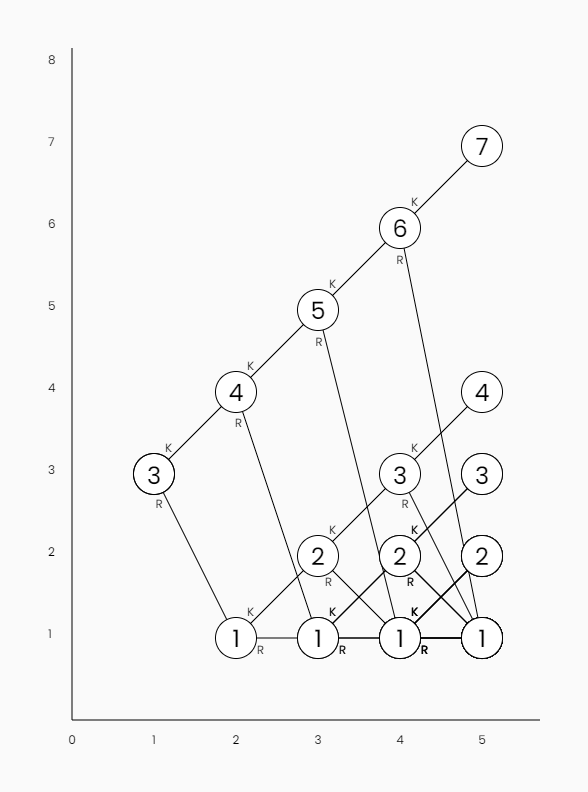
The problem, if we use full memoization, is as said before, correctness:
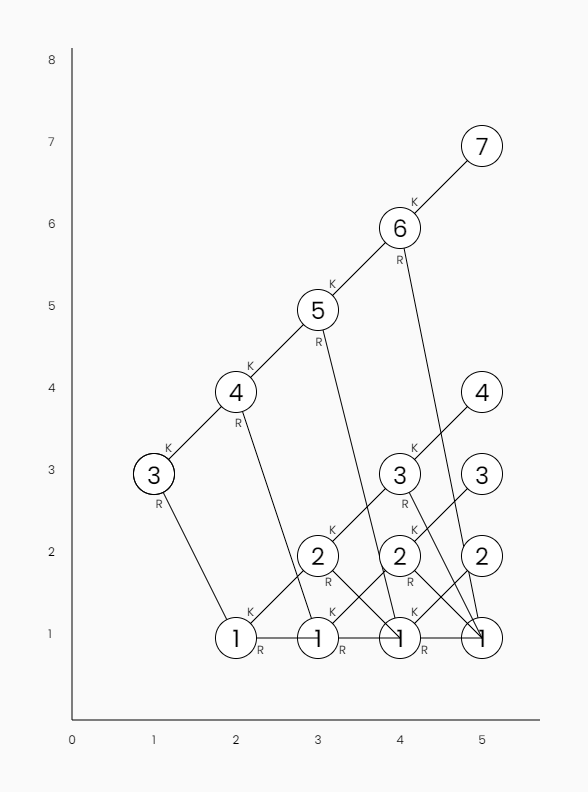
The optimization can be addressed by computing a more accurate model and just drawing the exact required line tangent to the nodes, so they don’t overlap with the other content.
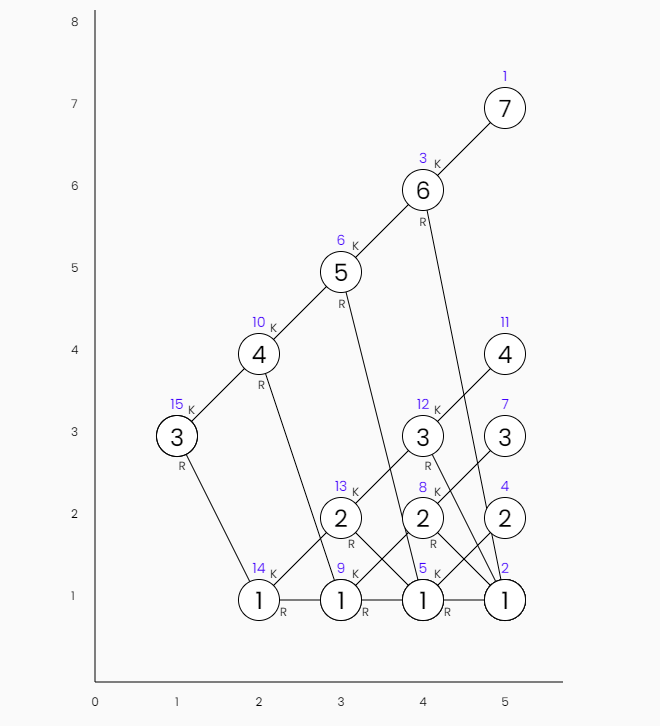
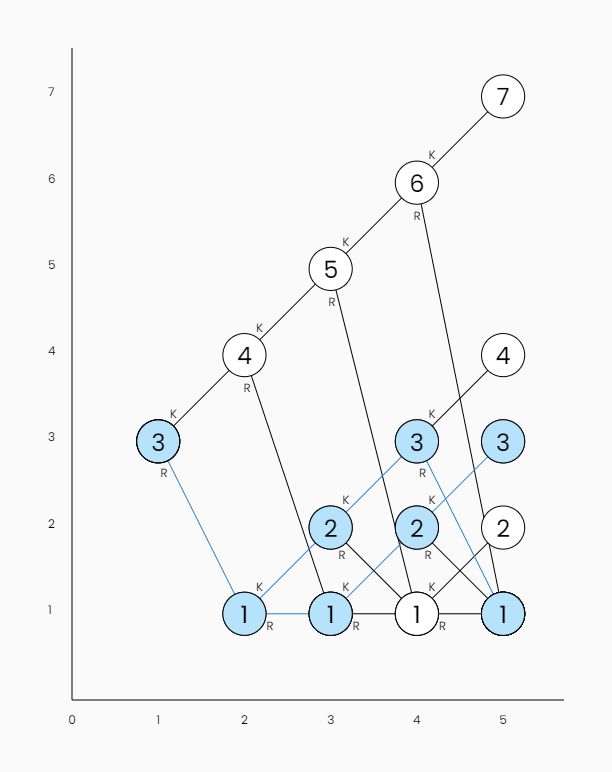
Order of Rendering
By counting the time a node was drawn with full memoization and drawing that position on top of the node as a blue/purple counter we can easily debug or follow the recursion process.
Recall that, as said above, the last nodes from the bottom are partially drawn more times later.
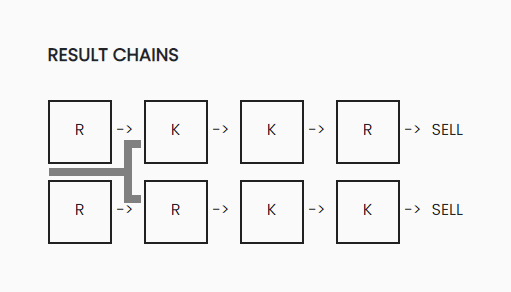
More Recursion
From the equipment replacement problem, we have one or more solutions that tell us what to do with the machine from the first decision year (result chains). For a given year, it might turn out that both options, keep and replace, yield the exact same effect, hence we have a bifurcation or fork: we have to follow two branches if we keep and if we replace. This produces a directed graph structure that looks similar to the tree that was developed.
Result Chains: Replace the first year and then, two ways can be taken for the next year.
Since the solution tree is the set of all possible solutions to the problem, and particularly, the model solution belongs to the tree which, with more clever work can be traced onto the same solution tree:
Traced Solution Tree: The model solution can be drawn into the tree.
Check out Pull Request: Implement solution tracing on mrm solutions-tree to learn more about it.
Caveats on Recursion
Many design and performance issues should be deeply addressed but that’s another topic. The problem is that languages like TS/JS and platforms like web browser runtimes are not good for these problems.
Recall that, just functional languages implement TCE and TCO at first class so the engineer or mathematician must be careful when using recursion. For mainstream languages, imperative loops are to be used instead.
When it comes to mathematical models it’s key to design declarative systems but general-purpose computers don’t support many abstractions and unfortunately, recursion is not so widely used due to the hardware being imperative as an obstacle.
In other words, be careful when using recursion. Recursion is key for defining mathematical models but computers don’t understand math really well and imperative loops are preferred for most implementations unless you know what you’re doing.
That is not a problem of recursion as is, but a problem of computers, so use recursion as a mathematician but think about it when engineering.
Solution Tree Feature
This case study for the feature Solution Tree | MRM | 2DP Repsymo Solver
is taken to obtain insight and then employ the machine replacement model and
the HTML5 Canvas API to address the modeling and design of this feature into a
typescript module providing rendering for XY-axis and the solution tree.
Basic trigonometry is needed to render some elements, like similar triangles which are useful to position the node labels.
Standard memoization with a Set helps to fix and optimize the recursive tree
traversal rendering and detailed analysis on the recursion used as well as
further insight on how this feature is evolving in the Repsymo Solver
complements the understanding of this topic.

-
Example Project: Machine Replacement Model was the first and main OR project devised and developed by Tobias Briones to solve and be able to explain the MRM to eventually end up building the 2DP Repsymo Solver ↩
-
A Canvas is a popular, more flexible, and performant tool for specific graphics than a user GUI library like for example the HTML DOM API or Android Views, but it’s a lower-level API, so it requires more work and design which is probably what we’re looking for ↩
-
A Canvas is a lower-level tool than a GUI toolkit, but it’s far from the advanced top-performant techniques ↩
-
Notice FP pattern matching ↩